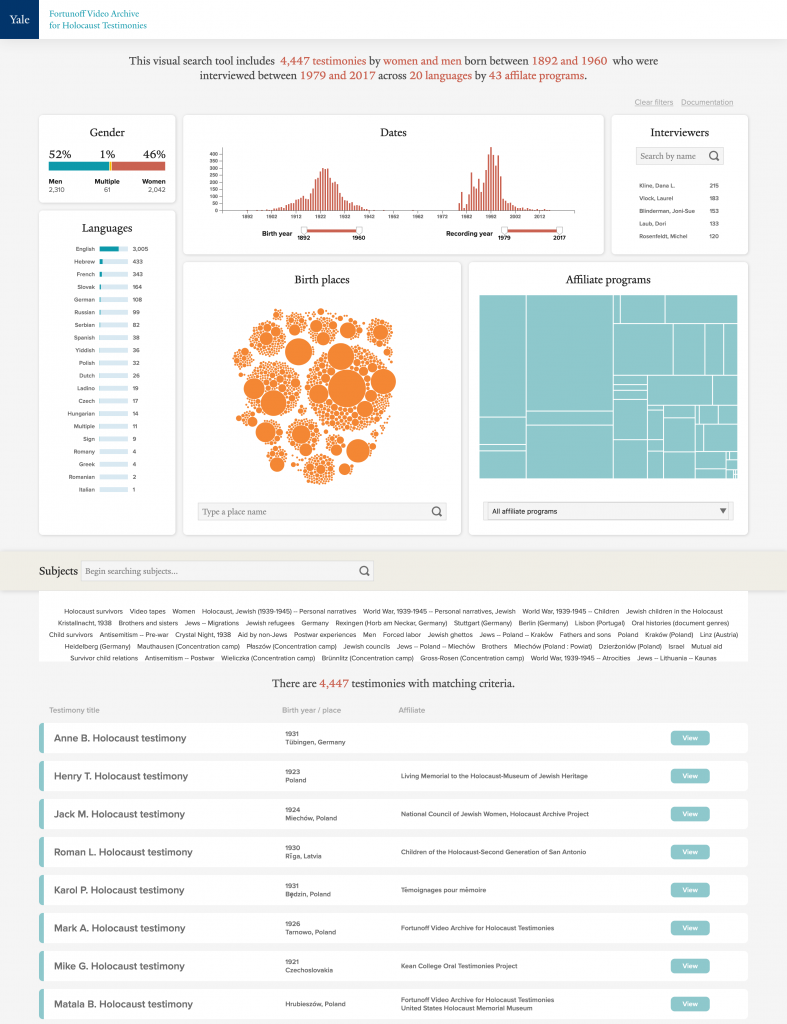
The Fortunoff Video Archive For Holocaust Testimonies and the Yale Digital Humanities Lab (DHLab) began building a Visual Search tool in 2019 in order to provide a simple overview of the Fortunoff Archive’s collection and enable quick filtering and discovery of relevant testimonies. Uninitiated researchers approaching Fortunoff’s collection, in particular undergraduate students tasked with using the collection in a course, could often find searching in Yale’s public access catalog for testimonies an opaque process. Although there is a catalog record for each of the circa 4500 testimonies in the collection, they are contained in the “books+” section of Yale’s public catalog — commingling with millions of other records. Despite the large number of items in the catalog, Books+ is still an excellent way to push the collection in front of students and researchers looking for resources on the experience of the Holocaust, who might be unfamiliar with our collection. After all, a simple search in the catalog for a term like “Gross-Rosen” would reveal dozens of relevant monographs as well as many of our testimonies, thereby opening up the research process to include archival materials that are often hidden in other search engines. The library catalog as primary search interface for our collection also made sense because we began this work before it even existed, and for many years it was the sole means of engaging electronically with library materials — long before the initiation of local archival search engines and EAD finding aid databases. Moreover, reflecting the era in the 1980s when our cataloging practices emerged, testimonies in the collection were indeed cataloged to a certain extent like monographs, each story an autobiographical recording tagged with important themes, geographic and institutional access points in the form of Library of Congress subject headings. But it was more of a a hybrid document, leaning on archival standards for description at the time, and it resembled the offspring of a catalog record for a monograph and an conventional archival finding aid, since each catalog record also contains a free text biographical note that summarizes basic information like year and place of birth, number of siblings, as well as a terse chronology of the individual’s life story as reflected in the underlying testimony. Normal monograph and archival cataloging praxis, however, would certainly find the level of detail in our records an unsustainable monstrosity, with some records including dozens of LC subject headings. We would disagree, and it has served our purposes well during an age when search was limited to Boolean library catalogs, and when we lacked detailed searchable indices and transcripts that more closely reflect the word-for-word text of the testimony. Thankfully, this exacting cataloging praxis lends itself well for repurposing in a project like the Visual Search.
Prior to the Visual Search, there was no shortcut for the painstaking process of learning the intricacies and idiosyncrasies of our catalog and the records it contained. One needed to game the catalog by using advance search and quotations marks to search for phrases within long, undefined text notes. For instance, while it was possible to tease out birthyears, affiliates, or places of birth by using phrase searching, it can be fraught and often does not yield relevant results. Searching through this valuable metadata, produced across decades of careful cataloging, evaluating whether the results are indeed relevant, reforming and rephrasing searches iteratively, is an enormous investment of time. Simplifying this process would free up researchers to tackle the more important task of actually watching the materials. Less searching, more watching was the motto behind this tool’s development.
In addition to search efficiency, we aimed to make the testimonies more discoverable by adding features not present in existing catalog tools. These tools provide robust search capabilities, but they first require the user to supply the terms to retrieve any results. This conventional query-based approach can be problematic for new and experienced researchers alike, because it limits what users can find to what they already know or expect to find in the collection. The Fortunoff Archive’s Visual Search tool — which aims to remove this limitation — evolved through several stages of design, data processing, and application development, with each stage informing the others: design and development work revealed limitations of the underlying collection metadata, and developing working prototypes with real data illustrated the need to revise design assumptions. The very process of repurposing conventional library catalog data for quantitative visualization has helped the Fortunoff Archive improve its underlying data. In fact, both researchers and internal staff can use this tool to perform sophisticated queries about the collection’s composition – the weight of gender, language, birth dates, the rise and cessation of Fortunoff affiliate recording projects worldwide. All of these queries can be performed with little prior knowledge, and instantaneously provide quantitative results expressed in a visual manner that allows the researcher to glean insights into the collection as a whole.
User interface and functionality
Visual Search is a tool for both data visualization and collection discovery. The default state of the tool displays the entire collection. As the user interactively applies filters the interface is updated to reflect only the resulting subset of the collection. The user interface is composed of the following sections, arranged in a single column layout: a prose summary, a visualization cluster, a subject heading pool, and a result list.
Prose summary
The prose summary describes the data being displayed in the lower sections. A human-readable introduction aims to give the tool a more human feel, and to describe to new users what they are seeing. The intent is for the summary to serve as minimal documentation for a tool that we hope most users feel is intuitive to use.

Visualization cluster
The visualization cluster displays seven data visualizations related to either biographical information about the interviewees, or the provenance information about the testimony itself.
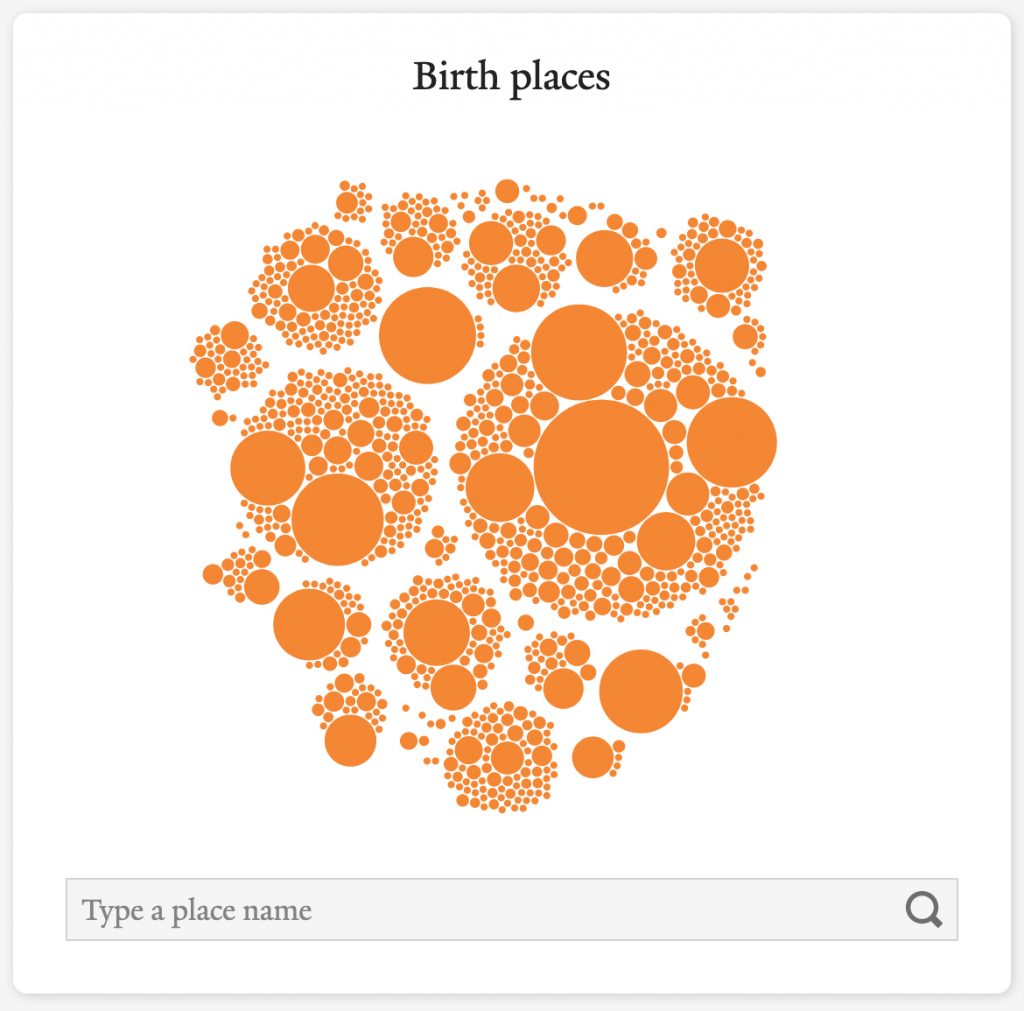
Biographical information includes: gender of interviewees, displayed as a stacked horizontal bar; language spoken during the testimony, displayed as a list with sparkline bar charts; birth year, displayed as a histogram; and place of birth, displayed a packed circle chart.
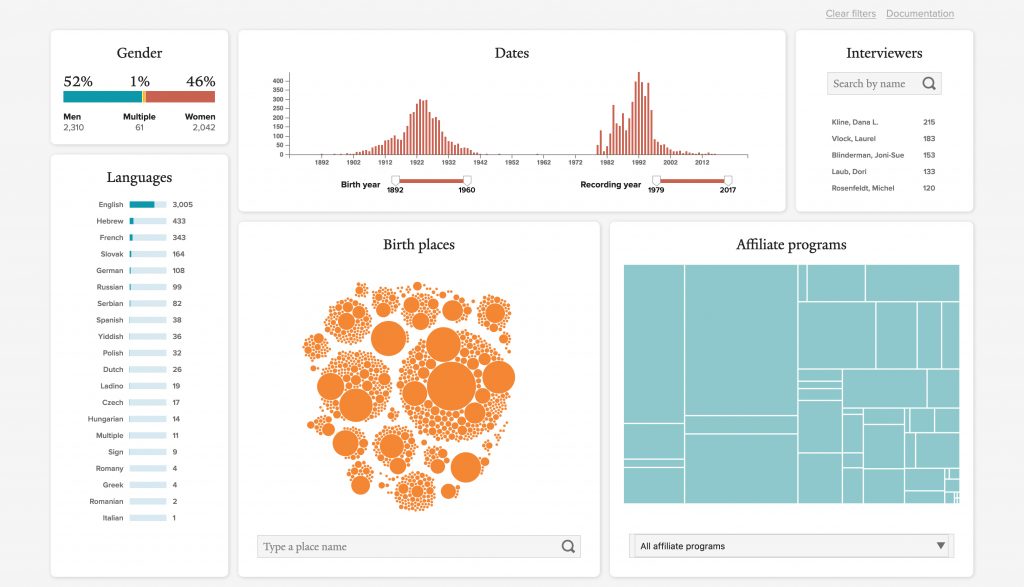
Provenance information includes: year of recording, displayed a histogram; interviewer, displayed as a simple list with counts; and affiliate programs, displayed as a treemap.
These visualizations also act as inputs. Interacting with these visualizations immediately applies a filter and updates the other visualizations, the prose summary, and the remaining sections. For example, clicking or tapping the “English” row in the language list will filter out all testimonies with a primary language other than English.
Subject heading pool
The subject heading pool displays all of the Library of Congress and local subject headings from every testimony in a continuously scrollable window. Each subject heading appears as a “pill” in user interface parlance. A text field allows a user to filter this list by searching for a term. With each keypress, the pool is automatically filtered to only subject headings that contain the term the user is typing. By clicking on a subject heading pill, a filter is applied and all testimonies without this subject heading are eliminated from the current subset. These subject headings may be combined, with each subject heading the user selects implying a Boolean AND between the terms.

Result list
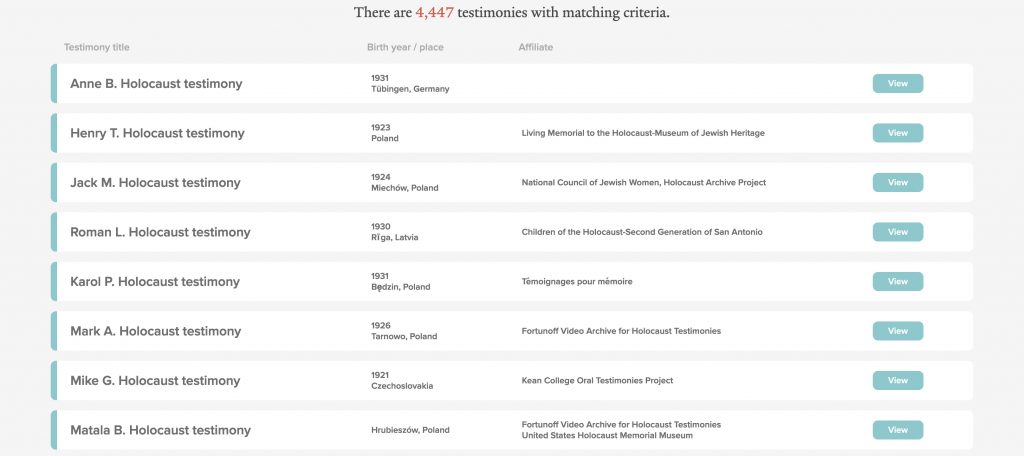
The result list contains a list of cards that represent a testimony, with basic testimony metadata and a link to view the testimony in the Fortunoff Archive’s digital access system Aviary. The result list is intentionally sparse and serves primarily as a means of navigating directly to the testimonies.
The source data
Most of the underlying data for this project comes from catalog records, which are stored in the relational database system ArchivesSpace, but a number of additional sources were used to augment and clean the catalog data. Interviewee gender and language existed in the catalog, but place of birth and birth year did not. Interviewer name, affiliate program, and recording year were all in the catalog as well.
Birth information was recorded on pre-interview forms that had been digitized and keyed into a spreadsheet some time ago. However, this data required significant quality assurance (QA) work to improve the quality (such as standardizing and de-duplicating place names), and it is likely that some issues remain. As we continue to improve data for this tool, we will continue to integrate these improvements into catalog records for the testimony.
The agile development process
This tool was developed according to agile philosophy, which uses a cyclical and incremental approach. We began designing without real, usable data to base these designs upon. This often required guesses that we knew would need correcting. For example, initial designs of the place of birth circle pack chart showed a very small number of cities, clustered into country groups. It also assumed that all values would be both a city and country pair. However, data processing work disabused us of those assumptions.
Here is an initial design, mocked up prior to any data cleanup:
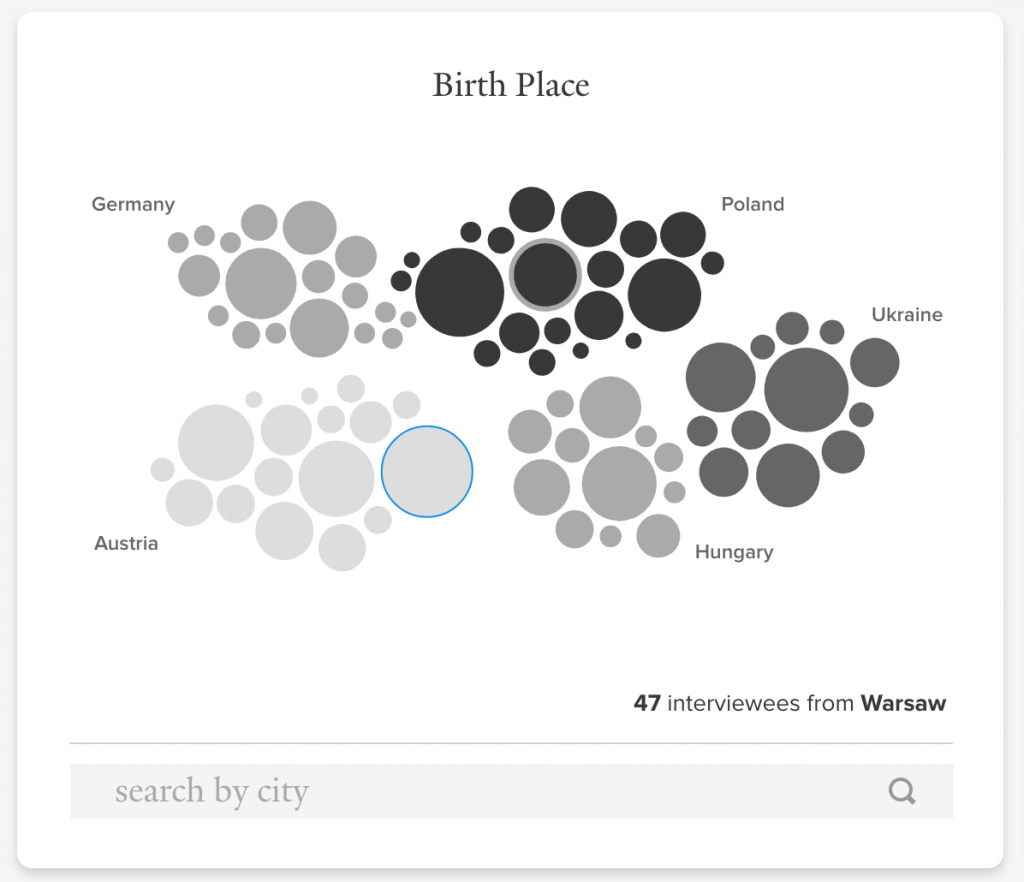
The following is a first working prototype of the circle pack layout. It has far more circles, and many of them are the smallest possible size, indicating they represent only one place name. The vast number of these “singleton” place names contradicted an assumption we had: A majority of place names would correspond to more than one testimony. We didn’t think it was likely that so many places were represented by only one interviewee. A more reasonable explanation was that there were many variations of spellings of place names. This turned out to be the case.
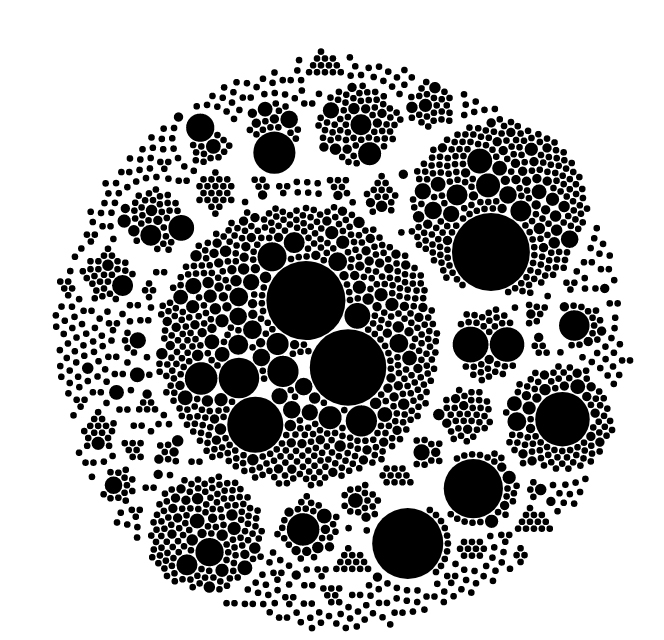
A great deal of work was put into cleaning up this data. When we finally did, we reached a state where the names were reconciled fairly well, so there were far less of these singleton place names.
The technology stack
A mantra of the DHLab is to use the lightest weight technology stack possible. This is important for the sustainability of humanities projects, which differ from many software products in terms of fundamental underlying assumptions. Software developed by a technology company can be built with the assumption that the application will receive support of developers, system administrators, and network engineers throughout the lifecycle of the product. Software developed for digital humanities projects often cannot make this assumption, so it is important to avoid unnecessary infrastructure, such as running servers, that must be maintained at a continual cost.
Visual Search is a single-page application (SPA), written primarily in JavaScript using the React frontend framework and D3 for data visualization. Because all of the data for this application (1) is small and (2) does not change often, we were able to build the application as a static website, without an application or database server. While it could be hosted inexpensively on an Amazon Web Services S3 bucket, we currently host it for free on GitHub. All of the code is open source, and it is designed in a modular fashion, so portions of it may be reusable.
Based on internal use of Visual Search, we expect that this tool will prove useful to researchers. It is our hope that it will not only make individual testimonies more readily accessible to researchers, but that it will also give users insight into the collection as a whole, highlighting the connections that link the testimonies together.
Visualizations by Monica Ong Reed, UX Designer, and Jake Kara, DH developer.
